Status Pages#
The Concordium dashboards have been removed and now redirect to CCDScan.
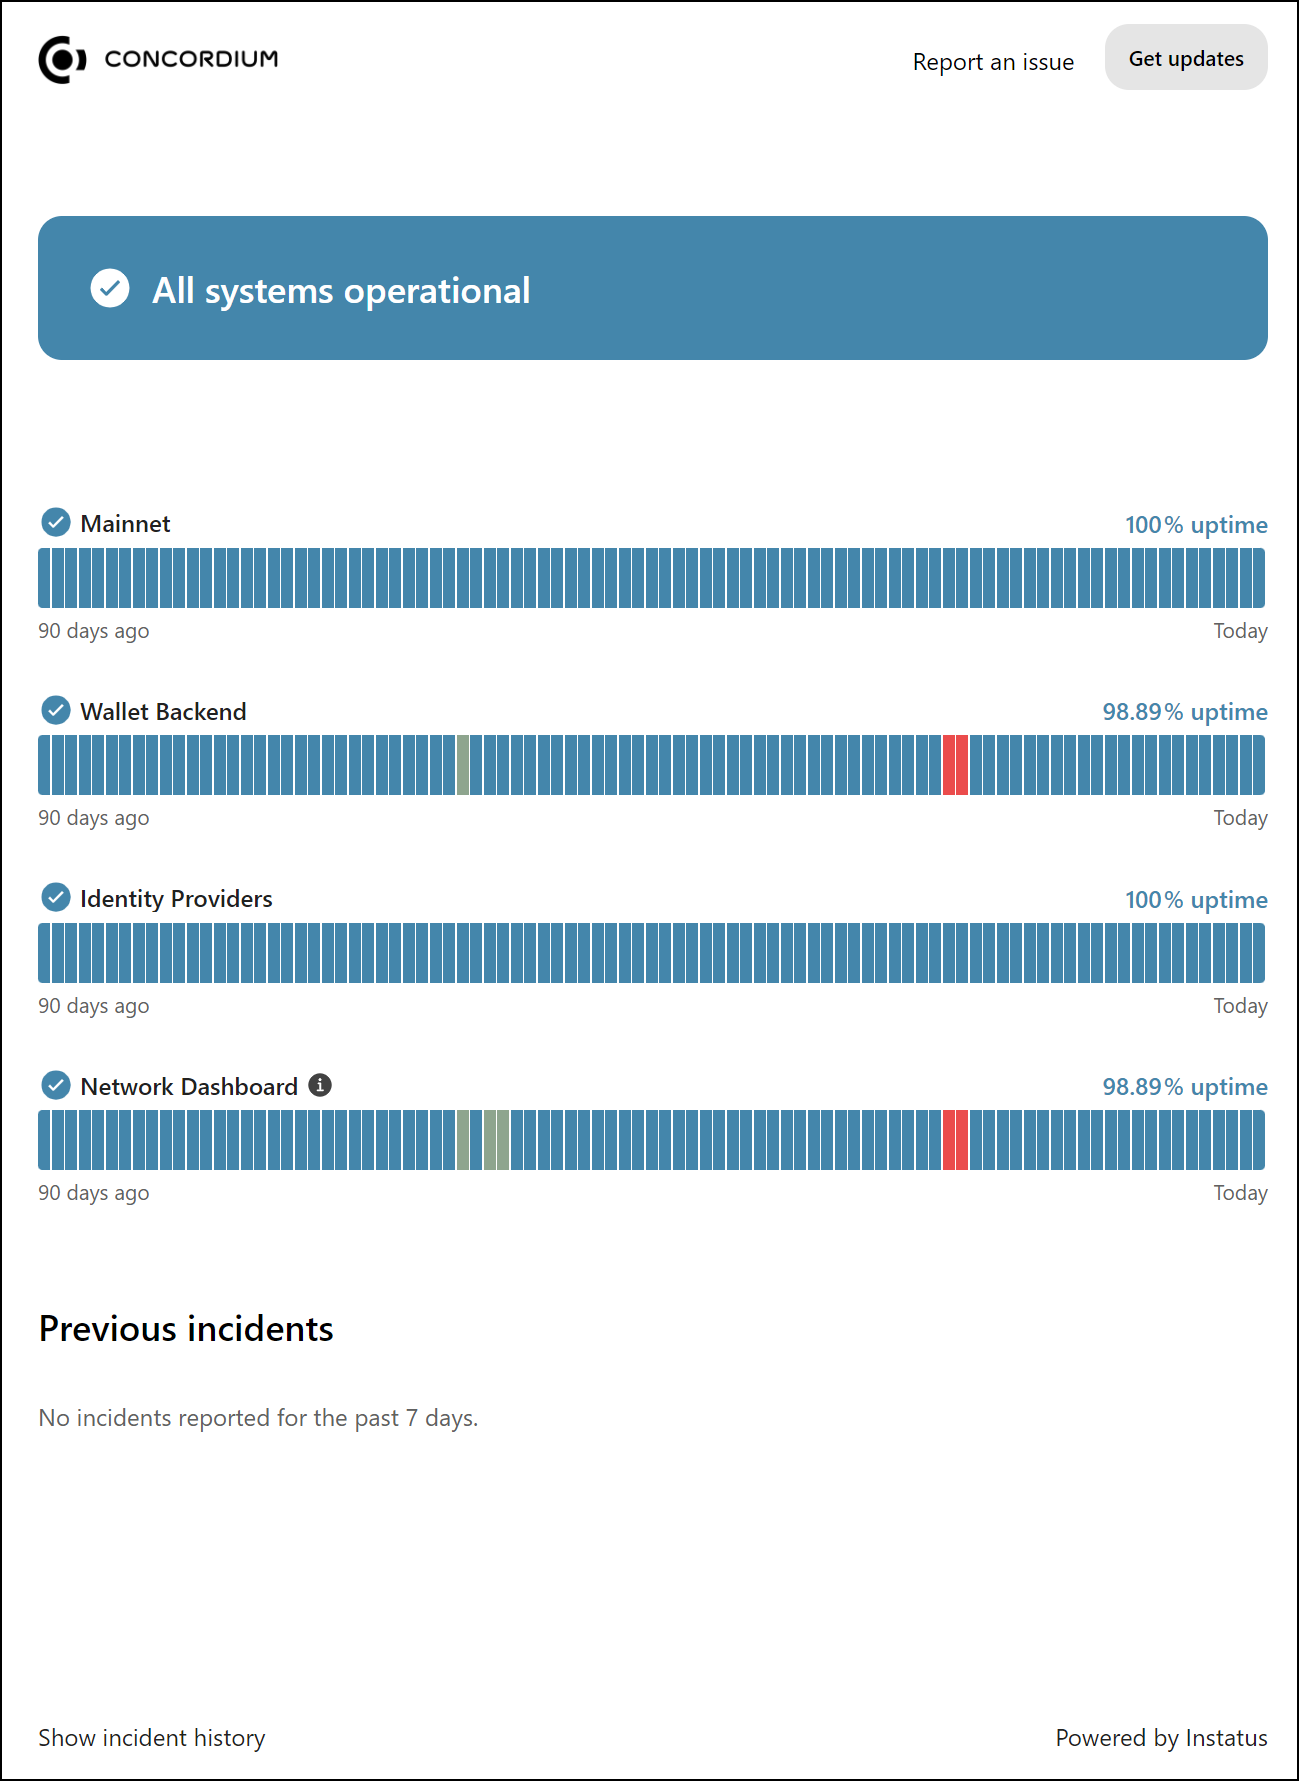
Status pages#
Both Mainnet and Testnet have a status page. The status page shows incidents and planned outages. To open the status page, click the link for the Mainnet status page or Testnet status page.
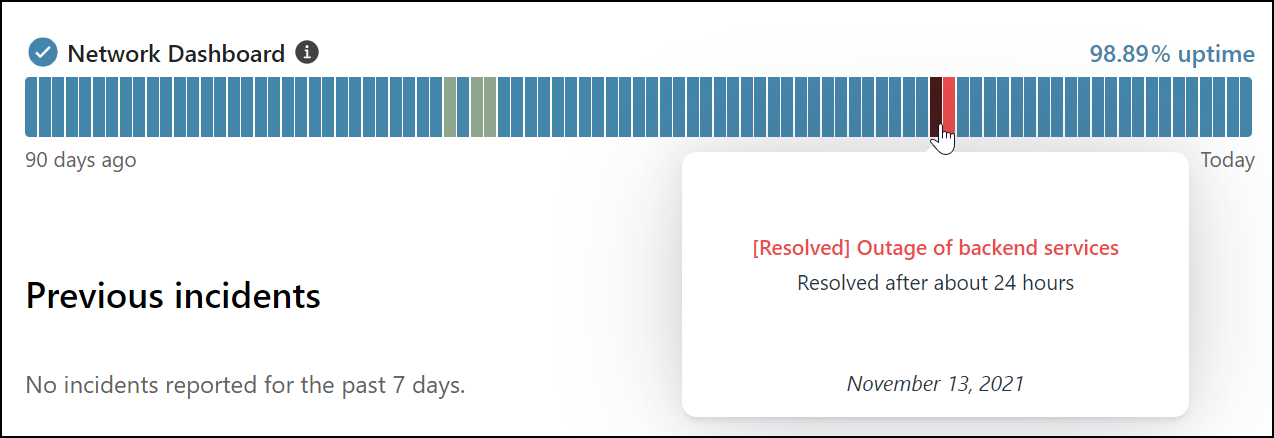
To see information about an incident, use your pointing device to hover over a colored block.
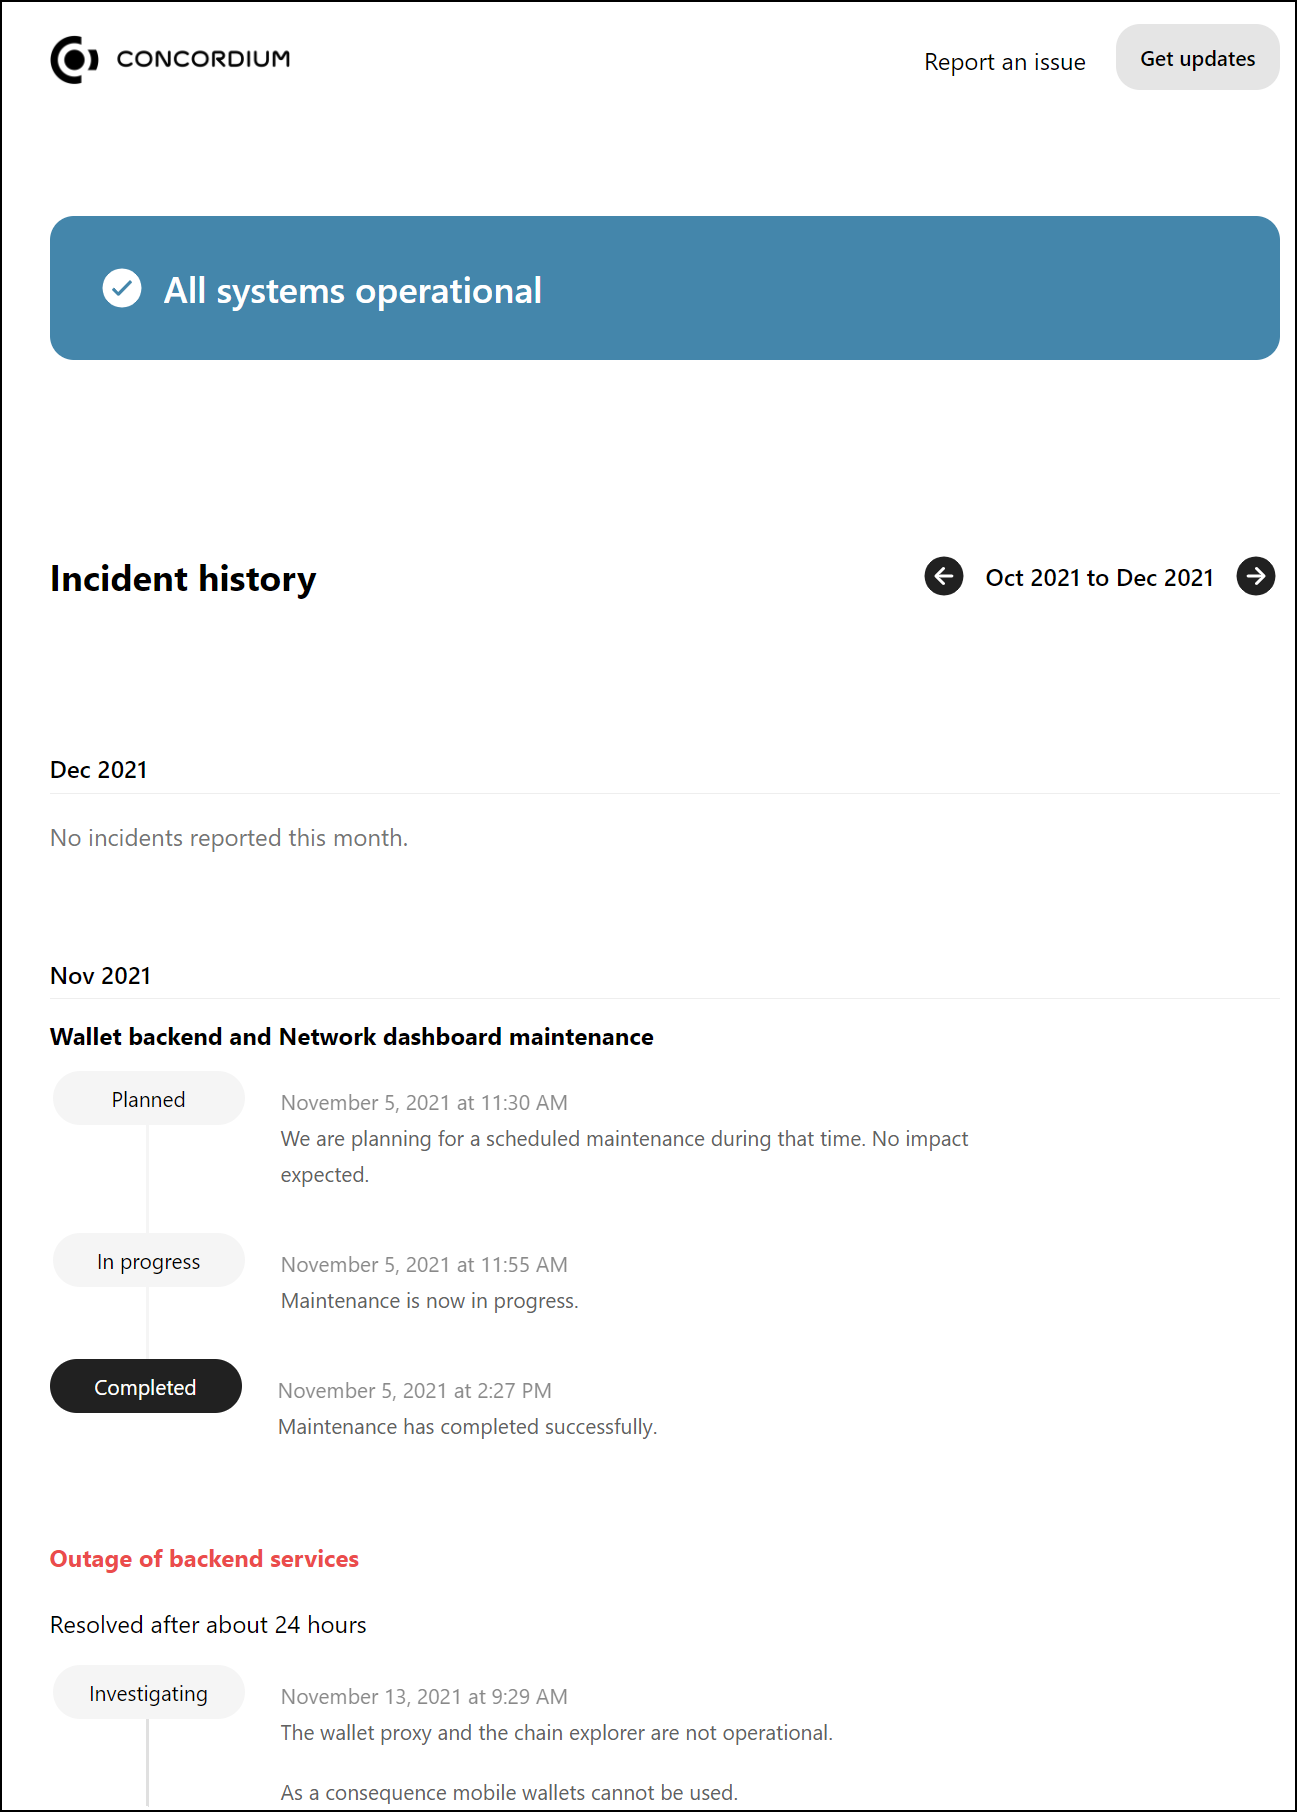
To see more details about incidents, click Show incident history to see a detailed log about incidents and downtime.
To report an issue, click Report an issue. This copies the Concordium support email address to your clipboard so you can write an email to support.
Click Get updates to subscribe to updates on the status page using your preferred delivery method.
